Climate Change
Supporting the SDGs Goals
SDGs

Goal 7:

Goal 12:

Goal 13:

Goal 14:

Goal 15:
Goal and Performance Highlights
Long-Term Goals
- 1 Reduce Scope 1 and Scope 2 greenhouse gas emissions intensity per total revenue by 20% by 2030.
- 2 Achieve net-zero greenhouse gas emissions by 2050.
Strategy
Performance Highlight
Challenges and Opportunities
Commitment
The Company recognizes that climate change and greenhouse gas emissions are critical issues affecting global sustainability, economic stability, quality of life, business continuity, and the resilience of its supply chain. At the same time, these challenges present opportunities to advance sustainable business practices, including expanding renewable energy initiatives, adopting innovative solutions to enhance energy efficiency, developing environmentally friendly products and services, and strengthening collaboration with business partners to support long-term sustainable growth.
Management Approach and Value Creation
Management Approach
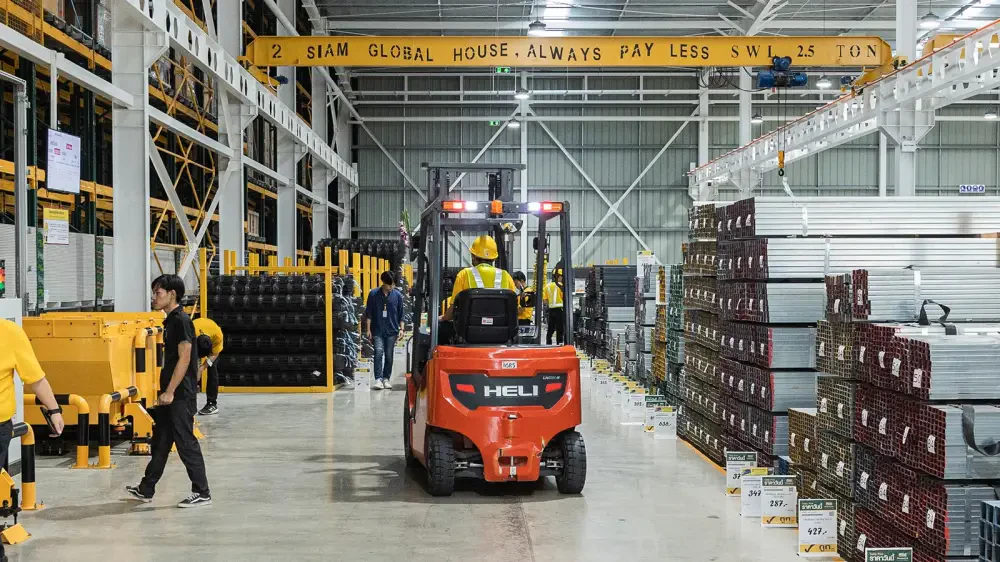
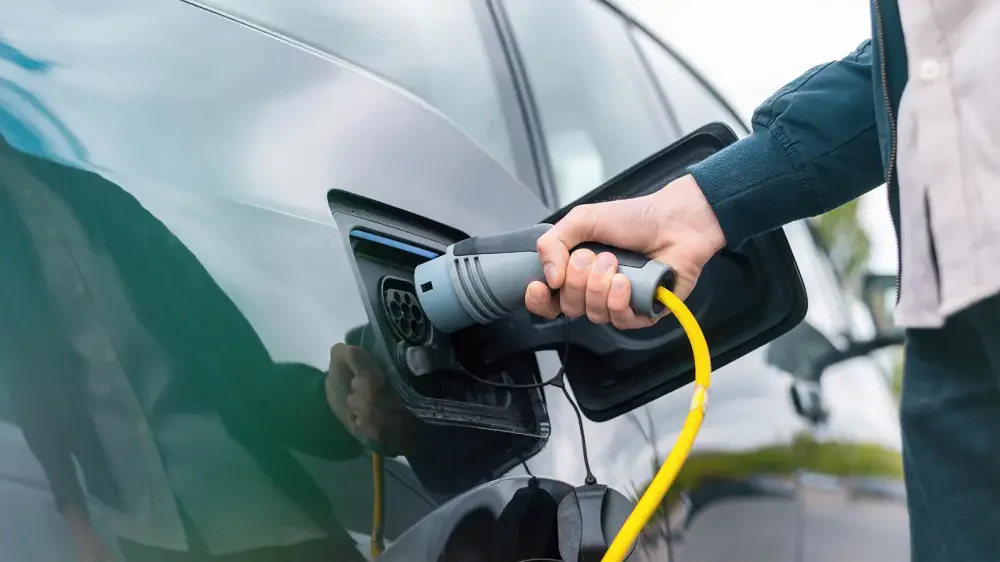
The Company operates a retail business specializing in construction materials and home decoration products, so its activities inherently consume energy and natural resources. Acknowledging its environmental impact, the Company is committed to reducing both direct (Scope 1) and indirect (Scope 2) greenhouse gas emissions. Key initiatives include transitioning from fuel-based equipment, tools, and vehicles to electric alternatives, utilizing solar energy to replace transmission-line electricity, and adopting energy conservation measures to reduce electricity consumption, which accounts for 58% of the Company’s total greenhouse gas emissions. These efforts reflect the Company’s dedication to sustainability and minimizing its carbon footprint.

IFRS S2 Climate-related Disclosures
The Company has prepared climate-related disclosures in accordance with IFRS S2, covering the four core elements of Governance, (1) Governance, (2) Strategy, (3) Risk Management, and (4) Metrics. The Company identifies and assesses material climate-related risks and opportunities that could reasonably be expected to affect its financial position, financial performance, and cash flows over the short, medium, and long term, using both qualitative and quantitative analyses and considering physical and transition risks.
Climate-related Transition Risks
| Climate-related Transition Risks | Potential Financial Impacts |
|---|---|
|
Policy and Legal
|
|
|
Technology
|
|
|
Marketing
|
|
|
Reputation
|
|
Climate-related Physical Risk
| Climate-Related Risk | Potential Financial Impacts | Action Plan |
|---|---|---|
|
Acute
Chronic
|
|
Acute
Chronic
|
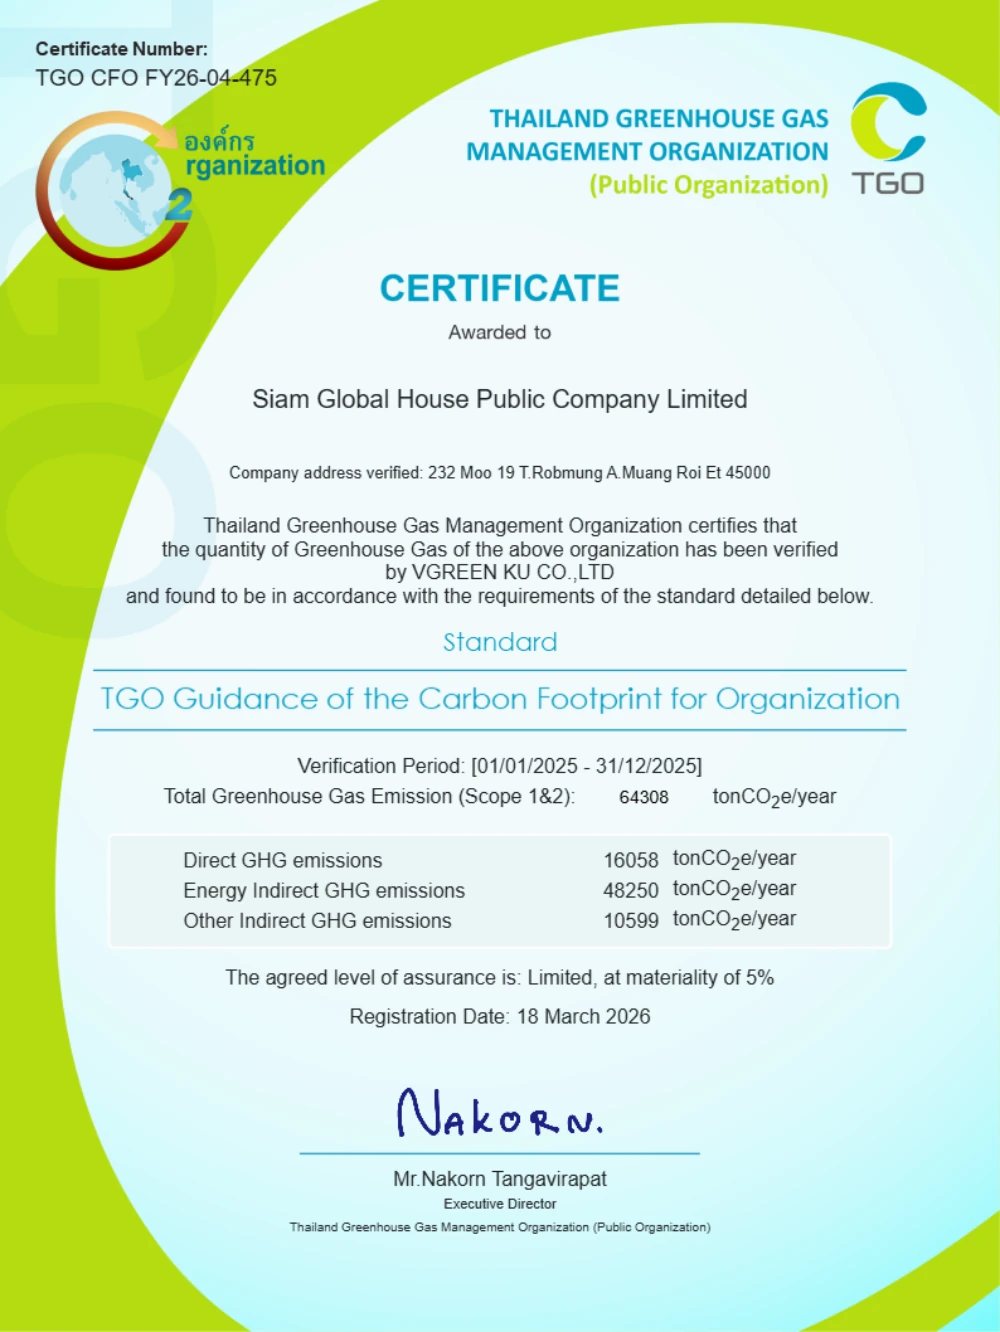
Carbon Footprint for Organization (CFO)
The Company places importance on managing environmental impacts from its operations and recognizes its role in contributing to the reduction of greenhouse gas (GHG) emissions in support of sustainable development. In 2022, the Company conducted a Carbon Footprint for Organization (CFO) assessment to measure and monitor GHG emissions from operation activities, including energy consumption, waste management, and transportation, with results reported in tons of carbon dioxide equivalent (tCO₂e).
The assessment covered Scope 1, Scope 2, and Scope 3 emissions and was reviewed and validated by VGREEN KU Co., Ltd., an auditing firm registered with the Thailand Greenhouse Gas Management Organization (TGO). The Company has designated 2022 as base year for setting targets, developing action plans, and continuously tracking long-term GHG emission reduction performance.
Scope of Greenhouse Gas Emissions
| Scope 1 | Scope 2 | Scope 3 |
|---|---|---|
|
|
|
Carbon Footprint for Organization: CFO

| GHG Emission Amount (Ton CO2e) | 2023 | 2024 | 2025 |
|---|---|---|---|
| Direct greenhouse gas emissions (Scope 1) | 11,142 | 14,131 | 16,058 |
| Indirect greenhouse gas emissions from electricity consumption (Scope 2) | 36,998 | 48,209 | 48,250 |
| Total indirect greenhouse gas emissions (Scope 3) | 9,314 | 11,747 | 10,599 |
| 1. Purchased goods and services | 577.73 | 606.67 | 604.09 |
| 2. Capital goods | - | - | - |
| 3. Fuel-and energy-related activities | 8,631.15 | 10,837.75 | 9,631.37 |
| 4. Upstream transportation and distribution | 36.5 | 5.23 | 3.40 |
| 5. Waste generated in operations | - | 234.84 | 289.79 |
| 6. Business Travel | - | - | - |
| 7. Employee commuting | - | - | - |
| 8. Upstream Leased Assets | N/A | N/A | N/A |
| 9. Downstream transportation and distribution | - | - | - |
| 10. Processing of sold products | N/A | N/A | N/A |
| 11. Use of sold products | - | - | - |
| 12. End-of-life treatment of sold products | 25.32 | 22.00 | 22.44 |
| 13. Downstream Leased Assets | 42.43 | 39.88 | 47 |
| 14. Franchises | N/A | N/A | N/A |
| 15. Investments | - | - | - |
Remark: The Company has assessed its organizational carbon footprint using data from 1 January to 31 December 2025, and the assessment has been verified.