Waste Management
Supporting the SDGs Goals
SDGs

Goal 11:

Goal 12:

Goal 14:
Goal and Performance Highlights
Performance Highlights
Challenges and Opportunities
Commitment and Goals
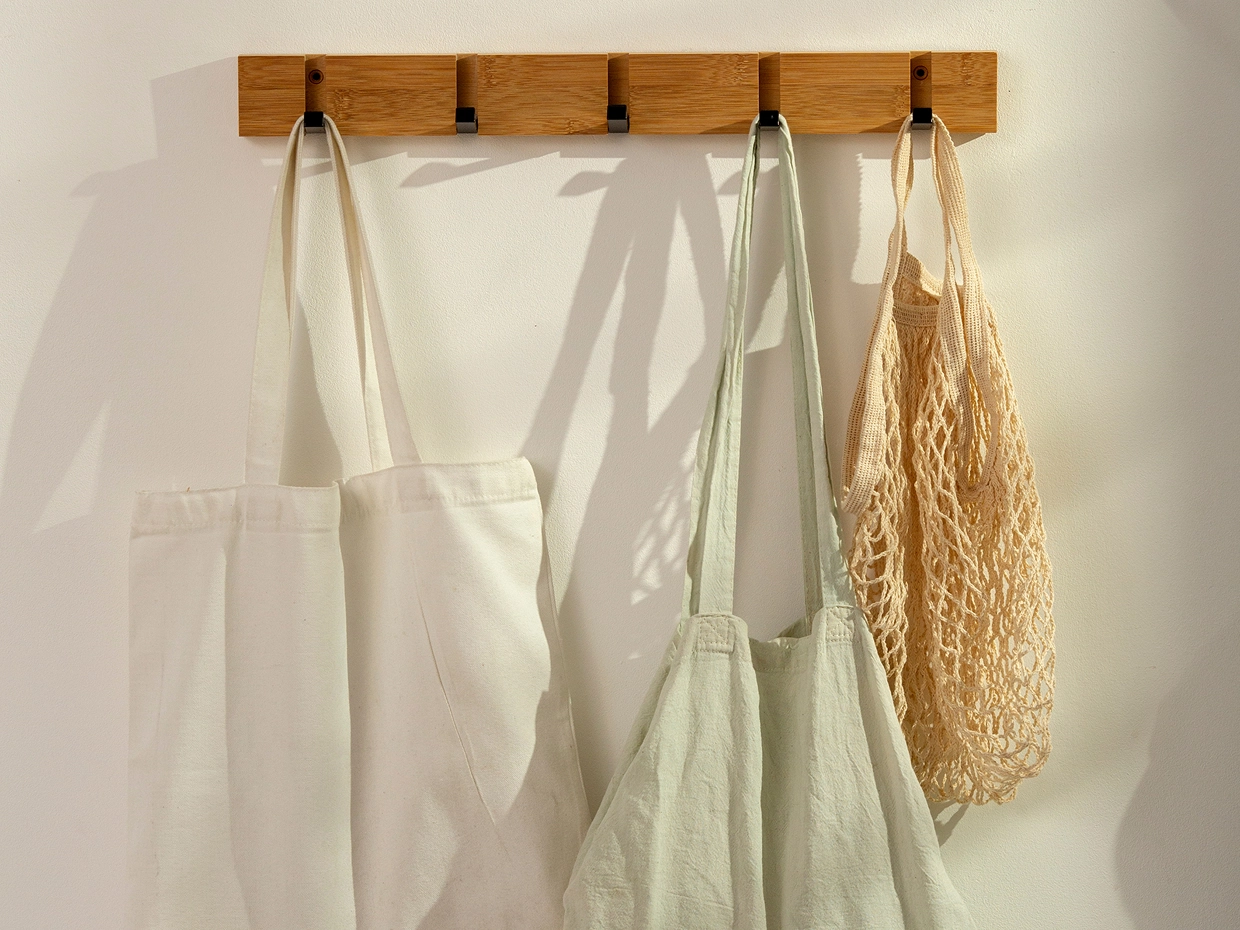
The company has policy and guidelines for proper and systematic management of waste and garbage generated in the store, no effects to the community, environment and conform to the laws. The waste and garbage generated from the operations, customers and employees; the company aims for reducing scrap waste including campaign for reducing the use of plastic bag.
Management Approach and Value Creation
Management Approach
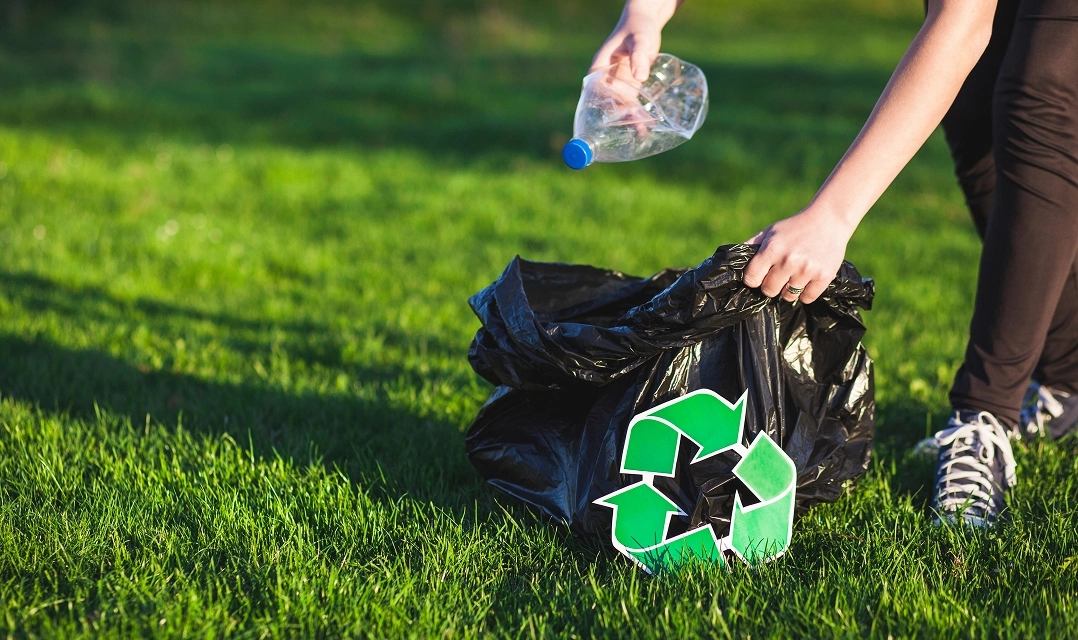
The company efficiently manages waste by implementing proper waste separation and adopting a circular economy approach. This promotes the efficient use of resources. Since 2022, the company has organized campaigns and conducted training for employees on waste separation to enhance their knowledge, understanding, and awareness of the importance of effective waste management.
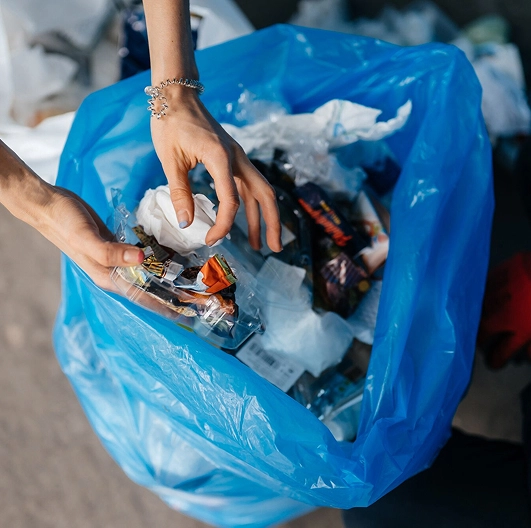
The company has conducted waste separation, which can be categorized into 3 types:
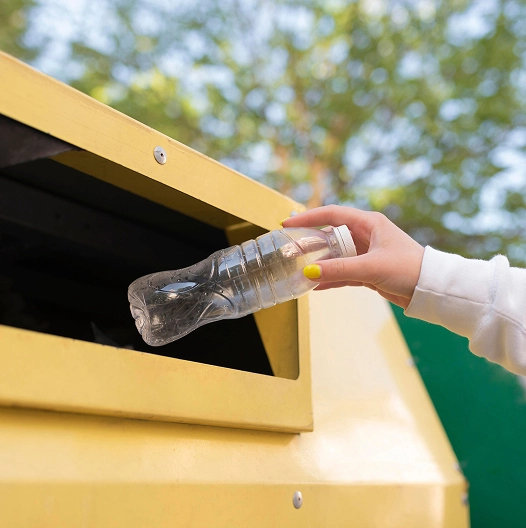
- Recycled Waste: This includes paper, cardboard, paper cartons, metal scraps, plastic bottles, glass bottles, and other metal scraps. The company processes and sells these items to local buyers, organizing an annual bidding.
- General Waste: This category encompasses plastic bags, plastic cups, tubes, foam boxes. The company arranges for separation and storage to facilitate disposal by municipal authorities following sanitary guidelines.
- Wet Waste (Organic Waste) : This involves food scraps from the company’s cafeteria. The waste is separated and made available for employees interested in using it for animal feed or for creating organic compost.
Performance for 2024
| Quantity of waste | 2024 (tons) |
|---|---|
| Quantity of Recycled Waste | 72 |
| Quantity of Landfill Waste | 272 |
| Quantity of Food Scraps | 173 |
| Quantity of Total Waste | 517 |
Sustainable Packaging Management
Commitment and Objective
The Company emphasizes the management of the products’ packaging by establishing a sustainable packaging management policy, as the aim is to reduce the environmental impact of the Company’s business operations. The packaging of products under the company brand (House Brand) must reduce the use of resources, be reusable, be recyclable, or be compostable in order to achieve efficient use of resources and reduce environmental impacts.
Management Guideline
The Company upholds the policy of selecting packaging that reduces environmental impacts and focuses on developing and designing sustainable products. This is achieved through collaboration with suppliers and manufacturers, following the waste reduction concept of the 3Rs (Reduce, Reuse, and Recycle) to support efficient resource management and reduce long-term environmental impact. This approach helps mitigate long-term environmental effects. As a result, the Company has the following success:
House Brand Packaging Usage Data in 2024
Plastic Packaging
| Total Plastic packaging (Tons) | Packaging made from recycled materials (percentage of total weight) | Recyclable plastic packaging (percentage of total weight) | Compostable Packaging (percentage of total weight) | Data coverage (percentage of product cots under the company’s control) | Target in 2024 (Ton) |
|---|---|---|---|---|---|
| 1,131.83 | 34.46 | 0.68 | 100 | 900 |
Non-plastic packaging
| Non-plastic packaging materials (Tons) | Total Weight of used packaging (Tons) | Recycled and/or Certified Material (% of total weight) | Data coverage (percentage of House Brand product) | Target in 2024 (%) |
|---|---|---|---|---|
| Wood/Paper fiber packaging | 11,849.31 | 53.18 | 100 | 70 |
| Metal (e.g. steel or aluminum) packaging | 77.761 | 1.69 | 100 | - |
| Glass packaging | - | - | - | - |